

Brazilian Immigrants in the United States

People holding Brazilian flags. (Photo: iStock.com/Denisfilm)
The United States is home to the largest Brazilian community outside Brazil, outnumbering the next four destination countries (Japan, Spain, Portugal, and Italy) combined. The Brazilian immigrant population in the United States has expanded steadily over the last four decades, shaped by shifting economic cycles in Brazil as well as family ties and sustained labor demand across sectors in the United States.
Still, the Brazilian-born population in the United States remains a relatively small one, standing at approximately 725,000 in 2024, or just over 1 percent of all 50.2 million U.S. immigrants.
Significant Brazilian migration to the United States began in the late 1980s and intensified in the mid-1990s, initially driven by young, single migrants pursuing economic opportunities. This pattern shifted in the late 1990s and early 2000s, as stricter U.S. visa policies and border controls reduced mobility, encouraging longer stays, permanent settlement, and family reunification. Immigration through legal and unauthorized channels increased notably after 2015, as economic conditions in Brazil deteriorated. Annual grants of lawful permanent residence (also known as getting a green card) rose from 10,400 in 2014 to a high of 28,900 in 2023. This upward trend in green-card issuance likely will cease, given that Brazil is among the 75 countries from which the Trump administration paused immigrant visa processing in January 2026.
At the same time, growing numbers of Brazilians arrived outside of legal pathways, reflecting both the pressure to emigrate and the emergence of smuggling networks facilitating movement from South America. U.S. Customs and Border Protection (CBP) recorded nearly 57,000 encounters of Brazilian nationals along the U.S.-Mexico border in fiscal year (FY) 2021, up from 3,100 in 2016. After the Mexican government in late 2021 began requiring Brazilians to obtain a tourist visa to enter Mexico, the number of encounters at the U.S. southern border declined to about 28,000 in both FY 2023 and FY 2024. Amid stepped-up U.S. immigration enforcement, the number of encounters with Brazilians fell to about 3,600 in FY 2025—following the general trend in sharply reduced activity at the border with Mexico.
Compared to the overall immigrant population in the United States, Brazilians tend to be recent arrivals and well educated: Nearly two-thirds arrived within the past 15 years and almost half have a college degree. They are also much more likely to have obtained a green card via employment and are less likely to be naturalized U.S. citizens.
This Spotlight provides information on the Brazilian immigrant population in the United States, focusing on its size, geographic distribution, and socioeconomic characteristics.
Click on the bullet points below for more information:
- Size of Immigrant Population over Time
- Distribution by State and Key Cities
- English Proficiency
- Age, Education, and Employment
- Income and Poverty
- Immigration Pathways and Naturalization
- Unauthorized Immigrant Population
- Health Coverage
- Diaspora
- Top Global Destinations
- Remittances
Size of Immigrant Population over Time
In 1980, about 41,000 Brazilian immigrants lived in the United States. This population doubled by 1990 and more than doubled again by 2000, reaching 212,000 (see Figure 1). The number of Brazilian immigrants grew by 114 percent between 2010 and 2024, even as the total U.S. immigrant population increased by 26 percent.
Figure 1. Brazilian Immigrant Population in the United States, 1980-2024

Sources: Data from U.S. Census Bureau’s 2010 and 2024 American Community Surveys (ACS), and Campbell J. Gibson and Kay Jung, "Historical Census Statistics on the Foreign-Born Population of the United States: 1850-2000" (Working Paper no. 81, U.S. Census Bureau, Washington, DC, February 2006), available online.
Distribution by State and Key Cities
Half of all Brazilian immigrants in the United States resided in one of three states as of the 2020-24 period: Florida (23 percent), Massachusetts (17 percent), or California (9 percent). The top five counties for Brazilian immigrants were Middlesex County, Massachusetts, and four counties in Florida: Broward, Orange, Miami-Dade, and Palm Beach. Together, these five counties were home to 23 percent of Brazilian immigrants in the United States.
As of the 2020-24 period, the greater Boston, New York, and Miami metro areas were the largest destination cities, home to 34 percent of Brazilian immigrants (see Figure 2). Orlando was the fourth largest metro area, followed by Los Angeles, Atlanta, Bridgeport-Stamford, Worcester, Philadelphia, and San Francisco.
Figure 2. Top Metropolitan Destinations for Brazilian Immigrants in the United States, 2020-24
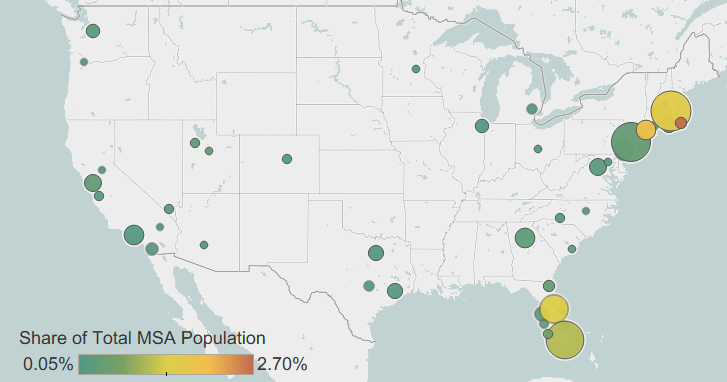
Notes: Pooled 2020-24 ACS data were used to get statistically valid estimates at the metropolitan statistical-area level for smaller-population geographies. Not shown are the populations in Alaska and Hawaii, which are small in size. For details, visit the Migration Policy Institute (MPI) Migration Data Hub for an interactive map showing geographic distribution of immigrants by metro area, available online.
Source: MPI tabulation of data from U.S. Census Bureau’s pooled 2020-24 ACS.
Click here for an interactive map that highlights the states and counties with the highest concentrations of immigrants from Brazil or other countries.
Click here for an interactive map that highlights the metro areas with the most immigrants from Brazil or other origins.
Brazilian immigrants are more likely to be proficient in English than the overall U.S. foreign-born population. While 47 percent of all immigrants ages 5 and older reported speaking English less than “very well” as of 2024, the number fell to 40 percent for Brazilian immigrants. At the same time, 9 percent of Brazilians reported speaking only English at home, compared to 16 percent of the total foreign-born population.
Age, Education, and Employment
In 2024, the median age of Brazilian immigrants was 40, lower than that of the overall foreign-born population (47) but slightly higher than that of the U.S. born (37). A greater share of Brazilian immigrants was of working age (between ages 18 and 64) than the overall immigrant population—81 percent and 76 percent, respectively—although both were far more likely to be of working age than the U.S. born (58 percent; see Figure 3).
Figure 3. Age Distribution of the U.S. Population, by Origin, 2024
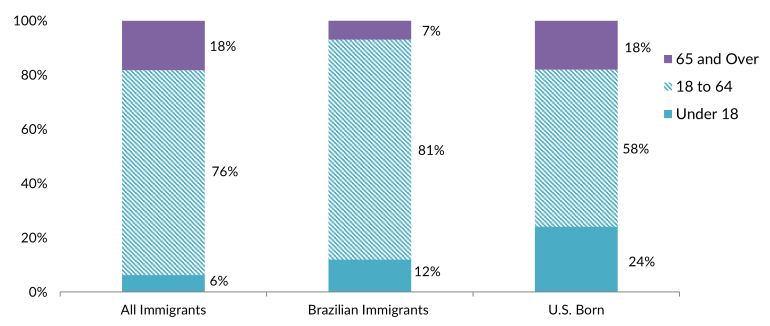
Note: Percentages may not add up to 100 as they are rounded to the nearest whole number.
Source: MPI tabulation of data from the U.S. Census Bureau's 2024 ACS.
Brazilian immigrants have relatively high rates of educational attainment compared to both the overall foreign- and U.S.-born populations. In 2024, 48 percent of Brazilian immigrant adults (ages 25 and older) held a bachelor's degree or higher, compared to 36 percent of all immigrants and 37 percent of the U.S. born. Meanwhile, just 10 percent of Brazilian immigrant adults lacked a high school diploma (see Figure 4).
Figure 4. Educational Attainment of the U.S. Population (ages 25 and older), by Origin, 2024
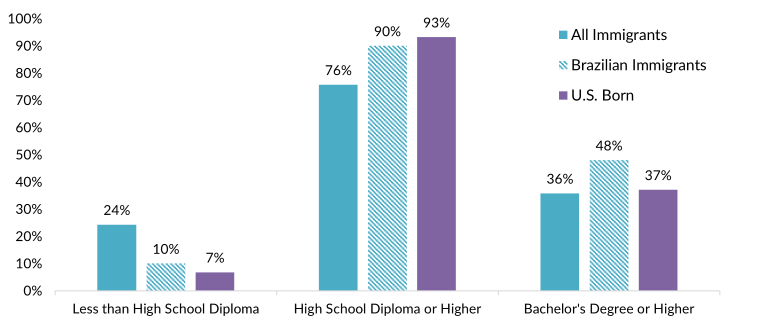
Note: Percentages may not add up to 100 as they are rounded to the nearest whole number.
Source: MPI tabulation of data from the U.S. Census Bureau 2024 ACS.
Click here for data on immigrants’ educational attainment by country of origin and overall.
About 17,300 Brazilian students were enrolled in U.S. higher education institutions during the 2024-25 school year, according to the Institute of International Education. They represented about 1 percent of the nearly 1.2 million international students enrolled that school year and were the largest student population from Latin America, ahead of Mexico (15,700) and Colombia (10,200).
Brazilian immigrants had a civilian labor-force participation rate of 73 percent in 2024, above that of both the overall foreign-born population (68 percent) and the U.S. born (63 percent). Brazilian immigrants were most likely to work in management, business, science, and arts occupations (42 percent), followed by service occupations (22 percent; see Figure 5).
Figure 5. Employed Workers in the Civilian Labor Force (ages 16 and older), by Occupation and Origin, 2024
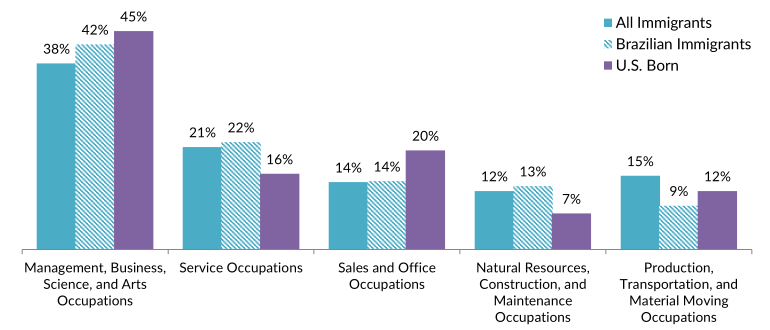
Note: Percentages may not add up to 100 as they are rounded to the nearest whole number.
Source: MPI tabulation of data from the U.S. Census Bureau’s 2024 ACS.
Brazilian immigrants had a median household income of $87,500 in 2024, above the median incomes of immigrant households overall ($82,400) and U.S.-born-led households ($81,400).
Still, approximately 13 percent of Brazilian immigrants were in poverty, roughly similar to rates for the overall foreign-born population (14 percent) and the U.S. born (12 percent). (The U.S. Census Bureau defined poverty as having an income below $32,100 for a family of four in 2024.)
Immigration Pathways and Naturalization
As of 2024, about 33 percent of Brazilian immigrants were naturalized U.S. citizens, compared to 51 percent of immigrants overall.
One reason for this difference is their relative recency of arrival: 64 percent of Brazilian immigrants arrived since 2010, compared to 38 percent of all immigrants (see Figure 6).
Figure 6. Brazilian and All Immigrants in the United States, by Period of Arrival, 2024
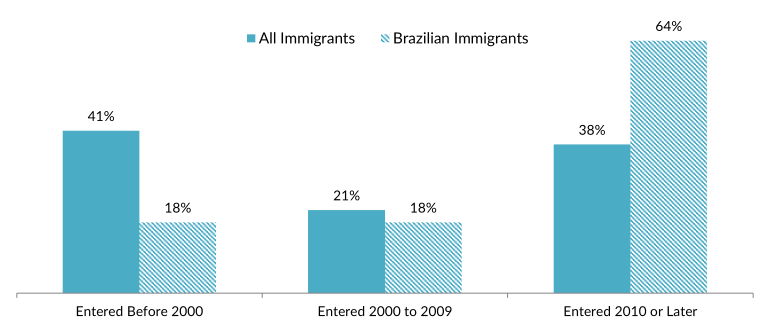
Note: Percentages may not add up to 100 as they are rounded to the nearest whole number.
Source: MPI tabulation of data from the U.S. Census Bureau’s 2024 ACS.
Nearly 28,900 Brazilian immigrants became lawful permanent residents (LPRs, also known as green-card holders) in FY 2023, the most recent year for which such data were available.
Virtually all obtained permanent residence that year via family reunification (50 percent) or employment-based sponsorship (49 percent). Brazilians were nearly three times as likely to obtain a green card through employer sponsorship than immigrants overall (17 percent). In contrast, only about 1 percent of new Brazilian LPRs arrived as refugees or asylees and less than 1 percent came through the Diversity Visa lottery.
Unauthorized Immigrant Population
The Migration Policy Institute (MPI) estimates that about 286,000 unauthorized immigrants were from Brazil as of mid-2023, accounting for 2 percent of all 13.7 million unauthorized immigrants in the United States. Brazil was the eighth largest country of origin for all unauthorized immigrants and the third largest in South America, after Venezuela and Colombia.
Click here for MPI data of the unauthorized immigrant population in the United States as of mid-2023.
About 3,700 Brazilian immigrants as of September 2025 were beneficiaries of the Deferred Action for Childhood Arrivals (DACA) program, which provides temporary deportation relief and work authorization to unauthorized immigrants who arrived as children and met the program’s education and other eligibility criteria. Brazilians represented less than 1 percent of all 505,900 active DACA recipients.
Click here to view the top origin countries of DACA recipients and their U.S. states of residence.
Brazilian immigrants were more likely than immigrants overall or the U.S. born to lack health insurance as of 2024: 20 percent versus 18 percent and 7 percent, respectively (see Figure 7). They were more likely than the overall immigrant population to hold private health insurance (61 percent versus 57 percent).
Figure 7. Health Coverage for Brazilian Immigrants, All Immigrants, and the U.S. Born, 2024

Note: The sum of shares by type of insurance is likely to be greater than 100 because people may have more than one type of insurance.
Source: MPI tabulation of data from the U.S. Census Bureau’s 2024 ACS.
The Brazilian diaspora in the United States was comprised of an estimated 950,000 individuals who were either born in Brazil or reported Brazilian ancestry, according to MPI tabulation of data from the U.S. Census Bureau’s 2024 American Community Survey.
Click here to see estimates of the 35 largest diasporas groups in the United States.
Globally, approximately 2.2 million Brazilians resided outside their country of birth, according to mid-2024 estimates by the United Nations Population Division. After the United States, the largest concentrations were in Japan (home to 207,000 Brazilian migrants), Spain (180,000), Portugal (172,300), Italy (138,000), Paraguay (85,000), France (72,000), and Australia (70,000). This spread reflects both historical labor migration patterns and the presence of long-established diaspora communities.
Click here to view an interactive map showing where migrants from Brazil and other origins have settled worldwide.
Migrants and other individuals worldwide sent approximately $4.7 billion in remittances to Brazil via formal channels in 2024, up from $4.4 billion in 2023. Remittance flows to Brazil have grown steadily over time, increasing by 52 percent from $3.1 billion in 2010 (see Figure 8). Remittances represented approximately 0.2 percent of Brazil's gross domestic product (GDP) in 2024.
Figure 8. Annual Remittance Flows to Brazil, 2000-24
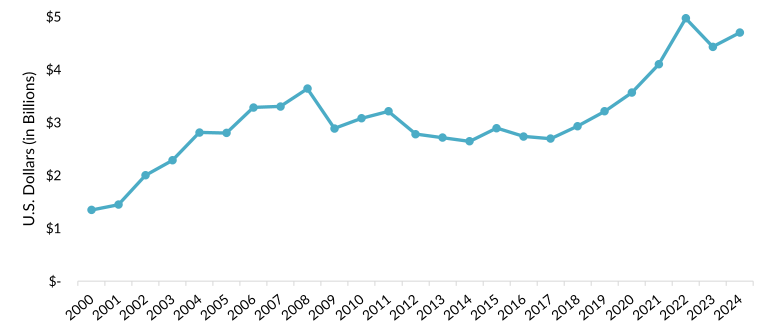
Note: Data for 2024 are an estimate.
Source: Dilip Ratha, Sonia Plaza, and Eung Ju Kim, “In 2024, Remittance Flows to Low- and Middle-Income Countries Are Expected to Reach $685 Billion, Larger than FDI and ODA Combined,” World Bank blog post, December 18, 2024, available online.
Click here to view an interactive chart showing annual remittances received and sent by Brazil and other countries.
Sources
Bridi Dacroce, Luisa. 2025. From the Margins: Navigating Race as Children of Brazilian Immigrants in the United States. Latino Studies 23: 315–35. Available online.
Brown University Library. N.d. Brazilians in the U.S.: Brazilian Immigration to the United States. Accessed May 8, 2026. Available online.
Ferragamo, Mariel. 2026. A Guide to the Countries on Trump's Travel Ban List. Council on Foreign Relations. Updated January 14, 2026. Available online.
Gelatt, Julia, Ariel G. Ruiz Soto, and James D. Bachmeier. 2025. Changing Origins, Rising Numbers: Unauthorized Immigrants in the United States. Washington, DC: Migration Policy Institute (MPI). Available online.
Gibson, Campbell J. and Kay Jung. 2006. Historical Census Statistics on the Foreign-Born Population of the United States: 1850–2000. Working Paper no. 81, U.S. Census Bureau, Washington, DC. Available online.
Institute of International Education (IIE). N.d. International Students: All Places of Origin. Accessed April 03, 2026. Available online.
Migration Policy Institute (MPI). N.d. DACA Recipients and Eligible Population, by Country of Origin. MPI Migration Data Hub. Accessed April 2026. Available online.
Ratha, Dilip, Sonia Plaza, and Eung Ju Kim. 2024. In 2024, Remittance Flows to Low- and Middle-Income Countries Are Expected to Reach $685 Billion, Larger than FDI and ODA Combined. World Bank blog post, December 18, 2024. Available online.
UN Population Division. 2024. International Migrant Stock 2024 by Destination and Origin. Available online.
U.S. Census Bureau. 2025. Income, Poverty, and Health Insurance Coverage in the United States: 2024. Press release, September 9, 2025. Available online.
---. N.d. 2024 American Community Survey — Advanced Search: S0201 Selected Population Profile in the United States. Accessed April 29, 2026. Available online.
U.S. Customs and Border Protection (CBP). 2026. Nationwide Encounters. Updated April 9, 2026. Available online.
U.S. Department of Homeland Security (DHS), Office of Homeland Security Statistics (OHSS). 2024. Table 3: Persons Obtaining Lawful Permanent Resident Status by Region and Country of Birth: Fiscal Years 2014 to 2023. September 2024. Available online.
U.S. State Department. 2026. Immigrant Visa Processing Updates for Nationalities at High Risk of U.S. Public Benefits Reliance. Updated February 2, 2026. Available online.