U.S. Immigrant Population by Metropolitan Area
U.S. Immigrant Population by Metropolitan Area
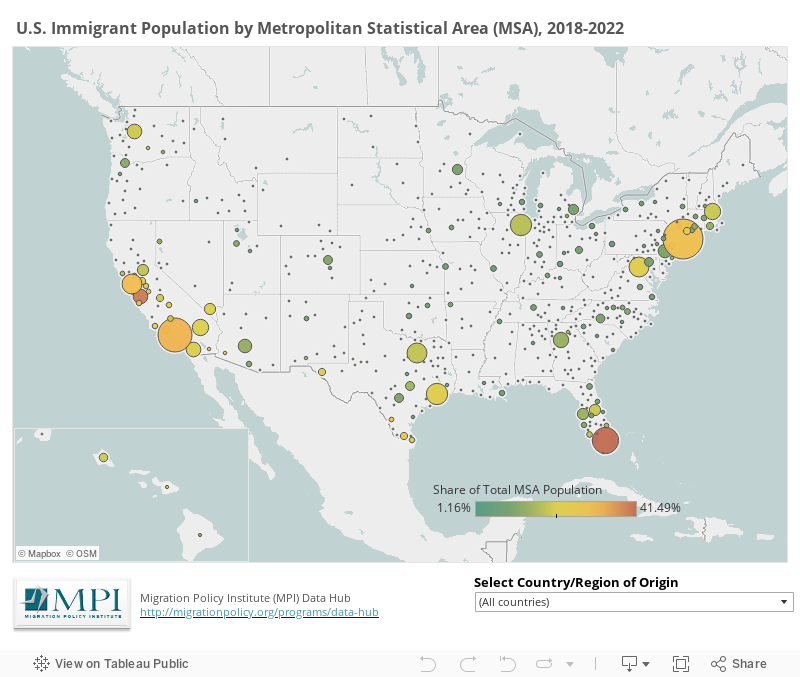
Use the map below to instantly display the metropolitan areas in which large number of immigrants resided during the 2018-2022 period. The colors represent the immigrant share of the total population for the metro area, and the bubble size reflects larger concentrations of immigrants. Use the dropdown menu under the map to select a particular country or region of origin. (And for Alaska, first zoom out the map by clicking the minus sign.)
1) The term "immigrant" (or "foreign born") refers to people residing in the United States who were not U.S. citizens at birth. This population includes naturalized citizens, lawful permanent residents (LPRs), certain legal nonimmigrants (e.g., persons on student or work visas), those admitted under refugee or asylee status, and persons illegally residing in the United States. "Metropolitan areas" refer to the greater metro areas such as Los Angeles-Long Beach-Santa Ana, CA or Chicago-Joliet-Naperville, IL-IN-WI.
2) Population estimates for metropolitan statistical areas with an immigrant population under 2,000 are not provided due to insufficient sample size. Rankings only apply to metro areas that meet this criterion.
3) Estimates for the Middle East in the “MENA: Middle East and North Africa” region are based on the following geographies: Northern Africa as well as Iraq, Jordan, Kuwait, Lebanon, Saudi Arabia, Syria, United Arab Emirates, Yemen, and “Other” Western Asia.
Migration Policy Institute tabulation of data from the U.S. Census Bureau's pooled 2018-2022 American Community Survey.