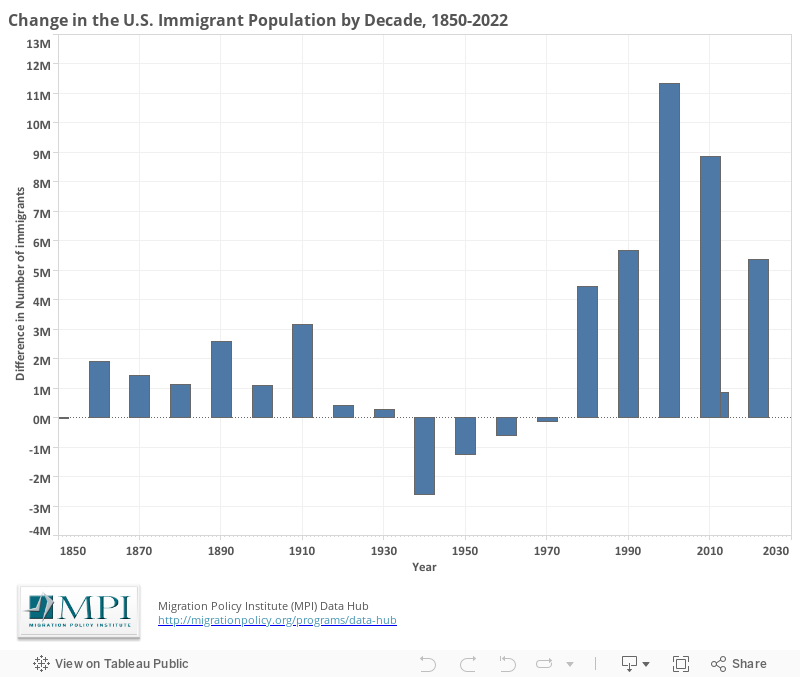
This chart displays changes in the immigrant population of the United States each decade, beginning in 1850. The net change is determined by increases resulting from new immigration and decreases resulting from immigrant mortality (e.g. old age) or emigration. The chart also displays changes for the 2012-2022 decade.
Migration Policy Institute tabulation of data from the U.S. Census Bureau, 2010, 2012, and 2022 American Community Surveys and 1970, 1990, and 2000 Census Decennial Census. All other data are from Campbell J. Gibson and Emily Lennon, U.S. Census Bureau, Working Paper No. 29, Historical Census Statistics on the Foreign-Born Population of the United States: 1850 to 1990, U.S. Government Printing Office, Washington, DC, 1999.