

Foreign-Born Wage and Salary Workers in the U.S. Labor Force and Unions
Source Spotlights are often updated as new data become available. Please click here to find the most recent version of this Spotlight.
Labor unions have departed from their historical skepticism of immigrant workers as the overall number of wage and salary immigrant workers and their proportion in the labor unions have increased. Instead, labor unions have become an important force in support of proimmigrant policies.
The support is not uniform across all policies, however. During the most recent congressional debate, labor unions generally favored legalizing the estimated 12 million unauthorized migrants, but they were divided over the proposals for new temporary worker programs. Service Employees International Union (SEIU) and UNITE HERE supported temporary worker programs, but the AFL-CIO and its many affiliates opposed them.
This Spotlight looks at the available data on immigrant workers and unions, highlighting variations in union representation rates of immigrant workers across industrial sectors.
The data come from the Current Population Survey (CPS). All data refer to wage and salary workers who are employed and are age 16 and older.
Click on the bullet points below for more information:
- In 2006, the number of employed foreign-born wage and salary workers stood at 19.74 million, a 66 percent increase over 1996.
- Between 1996 and 2006, the foreign born's share of all wage and salary workers increased from 11 to 15 percent.
- Of the 15.36 million union members in 2006, 12 percent were foreign born.
- Nearly one in 10 foreign-born wage and salary workers was a union member in 2006.
Definitions In this Spotlight, we use the following definitions: - Union members are members of a labor union or an employee association similar to a union.
- Union-covered workers are workers who report no union coverage but whose jobs are covered by a union or an employee association contract.
- Union-represented workers are workers who are either union members or covered by a union or employee association contract.
- Wage and salary workers are workers who receive wages, salaries, commissions, tips, payment in kind, or piece rates. This includes those employed in both the private and public sectors, but, for the purposes of the union membership, excludes all self-employed persons, regardless of whether or not their businesses are incorporated.
- All union-affiliated workers are wage and salary workers.
- The number of foreign-born union workers has increased 30 percent since 1996 while the number of native-born union workers has declined 9 percent.
- Native-born wage and salary workers have been more likely to belong to labor unions than foreign-born wage and salary workers over the past decade.
- The proportions of union members among both foreign-born and native-born wage and salary workers have declined since 1996.
- Among all union members, the share who are foreign born increased 3 percentage points from 1996 to 2006.
- Foreign-born wage and salary workers were underrepresented in labor unions compared to their share of all wage and salary workers.
- The percentages of foreign born among wage and salary workers in all sectors of the economy have increased since 2003.
- In 2006, foreign-born wage and salary workers were underrepresented in unions in manufacturing, construction, and mining sectors relative to their share among wage and salary workers in each of these industries.
In 2006, the number of employed foreign-born wage and salary workers stood at 19.74 million, a 66 percent increase over 1996.
The number of immigrant wage and salary workers increased from 11.89 million in 1996 to 19.74 million in 2006, a jump of 65.8 percent (see Figure 1). During the same period, the number of native-born wage and salary workers increased from 100.06 million to 108.50 million, or 8.4 percent.
|
|
||
|
Between 1996 and 2006, the foreign born's share of all wage and salary workers increased from 11 to 15 percent.
The proportion of wage and salary workers who were foreign born increased from 10.6 percent in 1996 to 15.4 percent in 2006 (see Figure 1).During the same period, the share of foreign born in the total U.S. civilian labor force increased from 10.8 percent (14.30 million) to 15.3 percent (23.15 million), and the share of foreign born in the total U.S. population increased from 9.3 percent (24.56 million) to 12.1 percent (35.67 million).
|
|
||
|

Of the 15.36 million union members in 2006, 12 percent were foreign born.
In 2006, 1.88 million, or 12.3 percent, of all 15.36 million union members were foreign born. The remaining 13.48 million (87.7 percent) were native born. Of the 16.86 million union-represented workers in 2006, 2.04 million, or 12.1 percent, were foreign born. The remaining 14.82 million (87.9 percent) were native born.
Nearly one in 10 foreign-born wage and salary workers was a union member in 2006.
Of the 19.74 million foreign-born wage and salary workers in 2006, 1.88 million (9.5 percent) were members of labor unions. An additional 160,000 (0.8 percent) were covered by a union or employee association contract. In total, 2.04 million (10.3 percent) had union representation (see Table 1).
The number of foreign-born union workers has increased 30 percent since 1996 while the number of native-born union workers has declined 9 percent.
The number of foreign-born union members rose from 1.45 million in 1996 to 1.88 million in 2006, or 30.0 percent. During the same period, the total number of foreign-born wage and salary workers whom unions represent grew from 1.62 million to 2.04 million, an increase of 25.8 percent (see Figure 2).
Meanwhile, the number of native-born wage and salary workers in labor unions declined from 14.83 million in 1996 to 13.48 million in 2006, or 9.1 percent. Overall, the number of native-born wage and salary workers age 16 and older with union representation decreased by 10.4 percent over the last decade, from 16.54 million to 14.82 million (see Figure 3).
|
|
||
|

|
|
||
|

Native-born wage and salary workers have been more likely to belong to labor unions than foreign-born wage and salary workers over the past decade.
Throughout the 1996-2006 decade, native-born wage and salary workers were more likely to belong to labor unions through either membership or coverage. In 2006, among the 108.50 million native-born wage and salary workers in the United States, 12.4 percent were union members and an additional 1.3 percent were covered by a union or employee association contract. Together they accounted for 13.7 percent of native-born wage and salary workers. In comparison, only 10.3 percent of foreign-born wage and salary workers had union representation (see Table 1).
The proportions of union members among both foreign-born and native-born wage and salary workers have declined since 1996.
In 1996, 12.1 percent of foreign-born wage and salary workers were union members and an additional 1.5 percent were covered by a union or employee association contract. By 2006, union membership dropped by 2.6 percentage points, to 9.5 percent, and union coverage dropped by 3.3 percentage points, from 13.6 percent to 10.3 percent, respectively (see Figure 4).
Likewise, union membership among native-born wage and salary workers decreased 2.4 percentage points, from 14.8 percent in 1996 to 12.4 percent in 2006. Union representation among native-born wage and salary workers dropped 2.8 percentage points, from 16.5 percent in 1996 to 13.7 percent in 2006 (see Figure 5).
|
|
||
|

|
|
||
|

Among all union members, the share who are foreign born increased 3 percentage points from 1996 to 2006.
While the number of foreign-born union workers increased, the total number of all union members declined from 16.27 million in 1996 to 15.36 million in 2006. This drop, along with an absolute increase in foreign-born union membership, raised the foreign born's share of union members from 8.9 percent in 1996 to 12.3 percent in 2006. Similarly, the union representation rate of foreign-born wage and salary workers in 2006 (12.1 percent) has increased 3.2 percentage points since 1996 (see Table 2 and Figure 6).
Foreign-born wage and salary workers were underrepresented in labor unions as compared to their share of all wage and salary workers.
For each year between 1996 and 2006, the percentages of the foreign born among union-represented workers were lower than the percentages of the foreign born among all workers.
In 2006, 15.4 percent of all wage and salary workers age 16 and older were foreign born, while the foreign born were 12.1 percent of union-represented workers (see Table 2 and Figure 6).
|
|
||
|

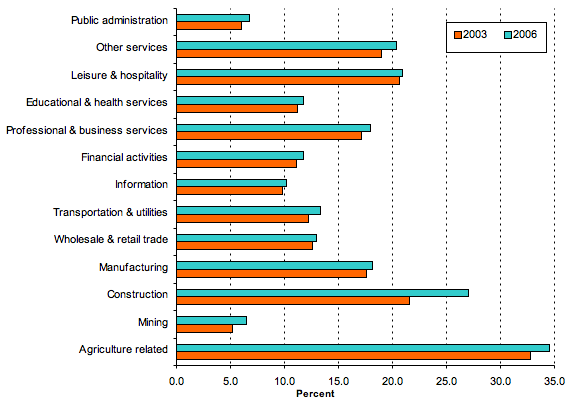
The percentages of foreign born among wage and salary workers in all sectors of the economy have increased since 2003.
From 2003 to 2006, the years for which comparable data are available, the percentages of foreign born among wage and salary workers increased within all industrial sectors. Some of these sectors include construction (from 21.5 percent to 26.9 percent), other services (from 18.9 percent to 20.2 percent) and agriculture-related industries (from 32.7 percent to 34.5 percent) (see Figure 7 and Table 3).
|
|
||
|
In 2006, foreign-born wage and salary workers were underrepresented in unions in manufacturing, construction, and mining sectors relative to their share among wage and salary workers in each of these industries.
Relative to their share among workers in manufacturing, construction, and mining, the foreign born were underrepresented among workers with union representation in the manufacturing (18.0 percent versus 12.6 percent in 2006), construction (26.9 percent versus 14.2 percent in 2006), and mining industries (6.4 percent versus 4.8 percent in 2006) (see Figure 8 and Table 3).
On the other hand, compared to their share among wage and salary workers, the foreign born were overrepresented among workers with union representation in other industries: leisure and hospitality (20.8 percent versus 30.2 percent in 2006), professional and business services (17.9 versus 22.1 percent in 2006), wholesale and retail trade (12.9 percent versus 15.1 percent in 2006), and agriculture-related industries (34.5 percent versus 40.7 percent in 2006).
About the Current Population Survey
This Spotlight is based on analysis of the Current Population Survey (CPS) Basic Monthly Data, 1996 to 2006 (annual averages). The U.S. Census Bureau conducts CPS, a monthly survey of about 50,000 households on unemployment and labor force participation, for the Bureau of Labor Statistics (BLS). BLS maintains a CPS webpage with information about the survey and downloads of recent data. The Basic Monthly CPS data are the primary source of labor force statistics in the United States. They are available for every month from 1976 on.
About the Data in This Spotlight
To construct the tables above, we extracted information for 1996 to 2003 and 2006 Basic CPS data from Data Ferret, a unique mining and extraction tool of the U.S. Census Bureau and the Centers for Disease Control. The 2004 and 2005 data were extracted from the raw Basic Monthly CPS data on the CPS official website.